This web site, https://www.vcru.wisc.edu/sdata, contains data from the laboratory of Philipp W. Simon, USDA-ARS Vegetable Crops Research Unit [Click here for our web page]
|
USDA ARS VCRU Data Server This web site, https://www.vcru.wisc.edu/sdata, contains data from the laboratory of Philipp W. Simon, USDA-ARS Vegetable Crops Research Unit [Click here for our web page] |
This map was published in Theor. Appl. Genet. (1999) 99: 58-64
B. S. Vivek and P. W. Simon
Linkage relationships among molecular markers and storage root traits of carrot (Daucus carota L. ssp. sativus)
Abstract A 109-point linkage map consisting of three phenotypic loci (P1, Y2, and Rs), six restriction fragment length polymorphisms (RFLPs), two random amplified polymorphic DNAs (RAPDs), 96 amplified fragment length polymorphisms (AFLPs), and two selective amplification of microsatellite polymorphic loci (SAMPL) was constructed for carrot (Daucus carota L. ssp. sativus; 2n=2x=18). The incidence of polymorphism was 36% for RFLP probes, 20% for RAPD primers, and 42% for AFLP primers. The overall incidence of disturbed segregation was 18%. Linkage relationships at a LOD score of 4.0 and q=0.25 indicated 11 linkage groups. The total map length was 534.4 cM and the map was clearly unsaturated with markers spaced at 4.9 cM. AFLP P6B15 was 1.7 cM from P1, AFLP P1B34 was 2.2 cM from Y2, and AFLP P3B30XA was 8.1 cM from Rs.
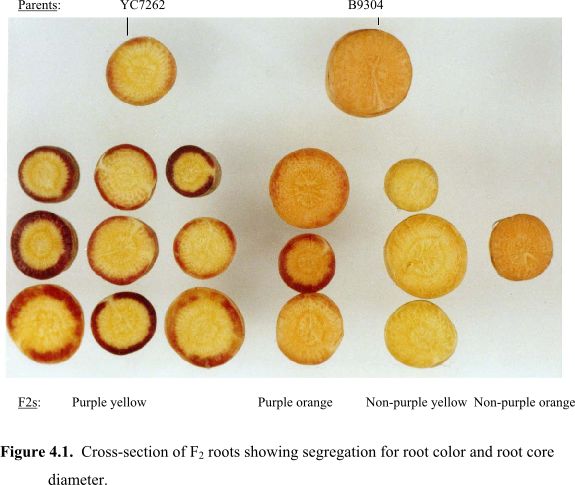
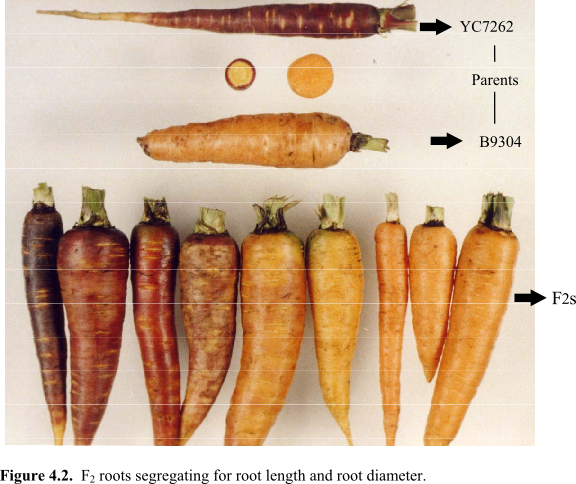
The mapping population of 103 F2 plants was derived from a single
F1 plant of the cross between fertile maintainer inbreds B9304 and
YC7262. B9304 had non-purple root phloem, an orange xylem (core) and a high reducing sugar content
(p1p1y2y2RsRs).
The roots of YC7262, a full-sib of B7262, had purple phloem, a yellow xylem and a low reducing sugar content
(P1P1Y2Y2rsrs).
(This description is from the TAG paper)
Details about individual markers are available by clicking on any of the markers on the map, or by going directly to the marker information page. Other details are also avaliable there.
Markers mapped at LOD = 4.0 and h = 0.25. All the linkage groups have been drawn to scale. RFLPs - marker names starting with "DCG''; RAPDs - markers K9 and S3-500; AFLPs - marker names starting with "P''; SAMPL - marker names starting with "Smp''. Underline - codominant marker; bold letters and/or sufix Y - null allele is from YC7262; regular letters and/or suffix X - null allele is from B9304. * - skewed at a=0.05, ** - skewed at a=0.01


